May 22 market snapshot
Key levels and metrics as of morning session

BTC holds near $77,537 just below the $78K resistance that has capped every May rally. ETH posts a fifth straight weekly loss at ~$2,127 as spot ETF outflows hit day eight. NEAR leads altcoins with +18%. Fear & Greed Index at 28.

| Coin | Price (approx.) | 24h | May-to-date |
|---|---|---|---|
| BTC | $77,537 | +0.1% | –4% |
| ETH | $2,127 | –0.2% | –5.4% |
| SOL | $86.80 | +2.2% | +4.4% |
| XRP | $1.38 | +0.8% | ~flat |
| NEAR | $2.02 | +18.2% | — |
| XMR | $382.75 | –6.0% | — |
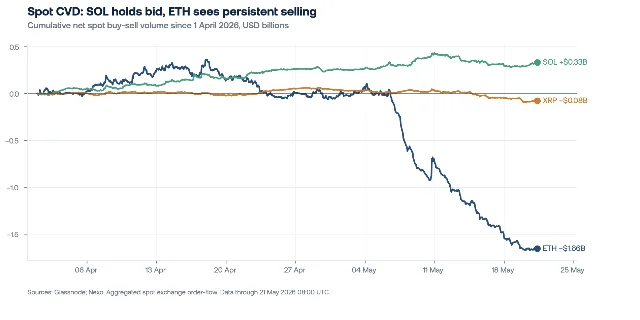
ETF flows, BTC/ETH key levels, SOL vs ETH capital rotation, and macro context for the week.
Top gainer NEAR up 18.16% to $2.02, VVV up 13.07%, WLD up 8.22%. Top loser Monero down 6%, ALGO down 4.53%.
Alternative.me's index reads 28 on May 22, down from 29 the prior day. Components: volatility 25%, volume 25%, social media 15%, surveys 15%, BTC dominance 10%, Google Trends 10%.
이 콘텐츠를 둘러싼 관점이나 맥락을 계속 보강해 보세요.